Performance analytics
Who this is for: coaches and team admins (team dashboard); athletes and parents (personal performance) Applies to: Android · iOS · Web
What this page covers
Groupset turns riders' synced rides, attendance, and timed segment efforts into two kinds of performance views. The team/group performance dashboard shows coaches and admins the whole group's numbers as three swipeable cards — Group Volume, Group Skills, and Segment Performance. The personal performance view shows an athlete (and their parents) their own weekly hours, miles, and climbing against the group's typical (median) rider. This page explains who can see which view, how the cards work, and how to read the numbers.
Before you start
- For the team dashboard: you must be a coach assigned to at least one training group, or a team admin. Any assigned coach can open it — the dashboard does not require a specific NICA license level. Parents and athletes don't see the team dashboard.
- For personal performance: the athlete themselves, their parents, and coaches/admins of the team can view it.
- Ride data comes from rides synced from a ride-tracking account (see Strava activities); attendance data comes from practice check-ins. No synced rides means empty ride numbers.
Understanding the evidence language
The dashboard's cards compare each rider against the group's median (the middle rider) and speak one plain dialect:
- Gap percentages — "+25%" means the rider is 25% above the group median for that metric; "-20%" means 20% below. On the volume and skills cards this is the only comparison language: there are no percentile ranks or tiers.
- Band chips — each gap carries a plain-language chip: well below, about average, or well above the group median.
- Same colors everywhere — the shaded band that shows how a rider's weekly training compares with teammates (the volume band) uses one shared set of colors, and riders are ordered the same way wherever it appears — so a color on the Group Volume card means exactly the same thing in the coach insights report.
- Unknown stays unknown — a rider with no recent synced ride is annotated No recent ride (or Not connected if they haven't linked a ride-tracking account), never rendered as a zero.
Percentile ranks still appear on the Segment Performance card (and throughout the personal-performance and group-change-request views). They compare one athlete against a peer set (usually their group): the 80th percentile means the athlete is faster/better than 80% of the group, and for timed segments, faster time is better.
The team/group performance dashboard (coaches and admins)
The dashboard is a stack of three cards you swipe (or tap) through. A single filter line sits above the cards showing your current choices (a date range and how many groups, for example) — tap it to open a filter sheet where you pick the reporting window and the training groups. Your choices apply to every card, take effect as you make them, and persist across swipes.
- Open the Performance dashboard from the app's navigation. (If you don't see it, you're not a coach or admin on this team.)
- Tap the filter line above the cards and pick the training group (group chips show the groups you coach) and the reporting window of dates you care about.
- Read the cards, left to right:
- Card 1 — Group Volume: each rider's rides and miles for the window against the group median, with gap percentages, band chips, and "No recent ride"/"Not connected" annotations. Riders at or more than 20% above the median also get an extra overload mark so big weeks stand out. The group median is stated on the card, and it's worked out only from riders who actually rode during the window — athletes with no rides don't drag it down.
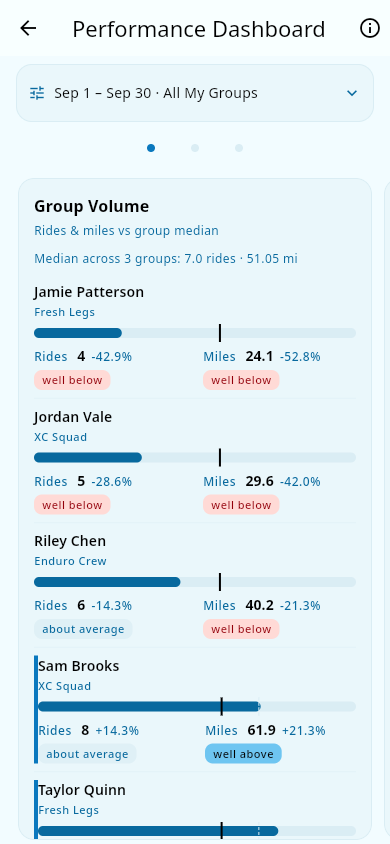 The Group Volume card: each rider's rides and miles against the group median.
- Card 2 — Group Skills: each rider's best time-trial climb and descent times against the group medians, as gap percentages ("+3.5%" = 3.5% slower than the group median; faster times show negative gaps). Riders without an admissible timed effort read No segment data — never zero. A rider's climb or descend time is a link: tap it to open their page at their Time Trial Efforts. Time trials come from time trial efforts recorded at practice.
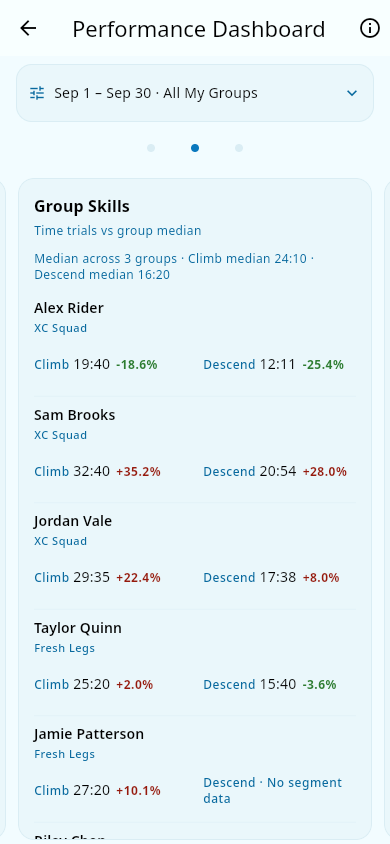 The Group Skills card: climb and descent times against the group medians.
- Card 3 — Segment Performance: per-segment dot plots ordered by fastest time, plus the athlete table with percentile columns. Each rider's dot is color-grouped by where they sit in the group: the top quarter (75th percentile and up), the middle half, and the bottom quarter. Uphill and downhill segments are identified by the course's elevation. Tap a rider's dot on a segment chart to open that rider's Time Trial Efforts for that segment; the distance, elevation, and saddle-time dots instead open the rider's performance tab.
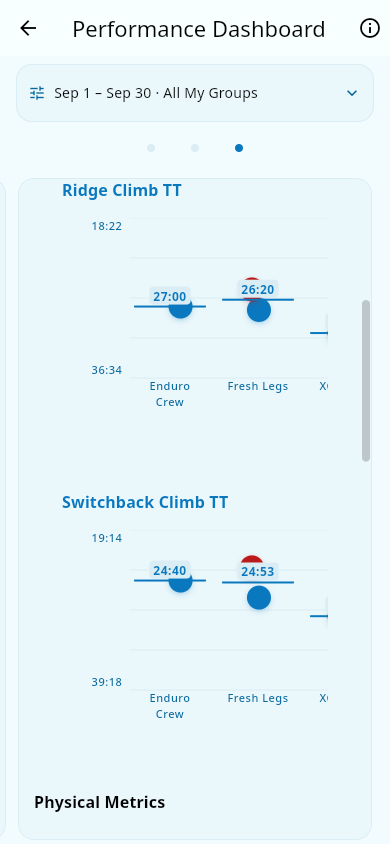 A segment dot plot: riders ordered by fastest time, grouped by where they sit in the group.
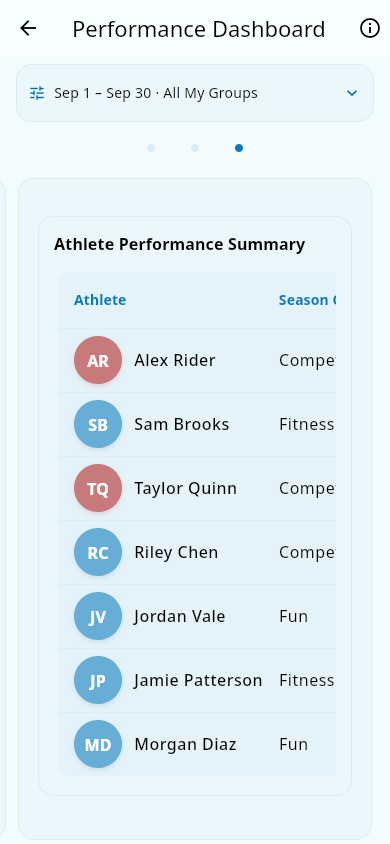 The athlete table: each rider's percentile on each timed segment.
- The page dots under the cards jump straight to a card when tapped — handy when swiping isn't convenient.
What you should see: Group Volume's median line ("Group median: 4.0 rides · 25.00 mi") and per-rider gap rows, then Group Skills' climb/descend medians, then the segment dot plots. A coach or admin who isn't allowed to see a requested group's data gets a clear access message on the card instead of numbers — nothing crashes and no raw data is shown.
From a coach-insights action straight to the card
When a Coach insights action sends you to the dashboard, it opens directly on the relevant card: a volume check or volume conversation lands on Group Volume, and climb/descend skill work lands on Group Skills — with the rider's row highlighted and the card noting it's showing the action's 28-day insight window. You can swipe away freely; the pinned window stays until you change it yourself.
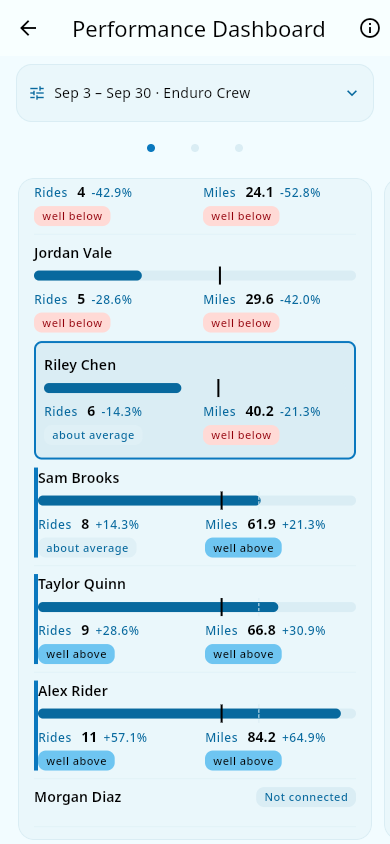 Arriving on the Group Volume card from a coach-insights action, with the rider's row highlighted.
Personal performance (athletes and parents)
- Open your own performance view (athletes) or your child's Performance tab from their member/child page (parents).
- Look at the weekly cards — the last several weeks, each showing the athlete's hours, miles, and elevation gain against the group's median (the middle rider of the group), plus this week so far. Bars make the comparison visual.
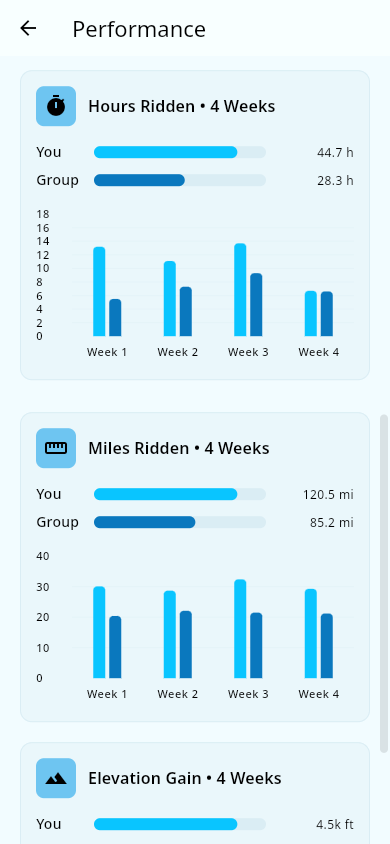 Weekly cards: the athlete's last four weeks against the group median.
- Below that, review segment efforts — their times on timed segments — and any attendance and saddle-time cards. A rider's Time Trial Efforts panel is labelled "Season bests — Group Skills cards use the reporting window" to remind you that this panel always shows season bests, while the Group Skills card compares the reporting window you picked. (In the report, that's the coach's 28-day insight window.)
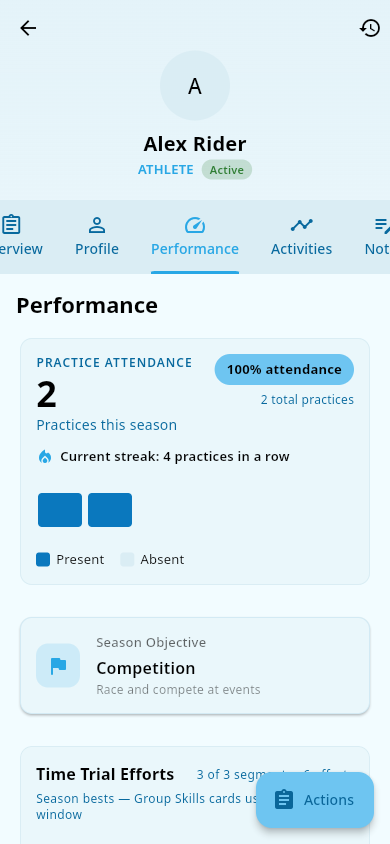 The performance stats view: the athlete's key numbers at the top.
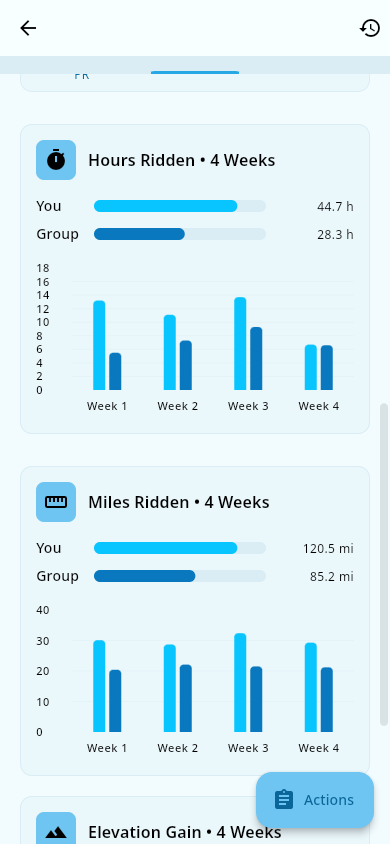 Saddle-time weekly cards: the athlete's time on the bike against the group median.
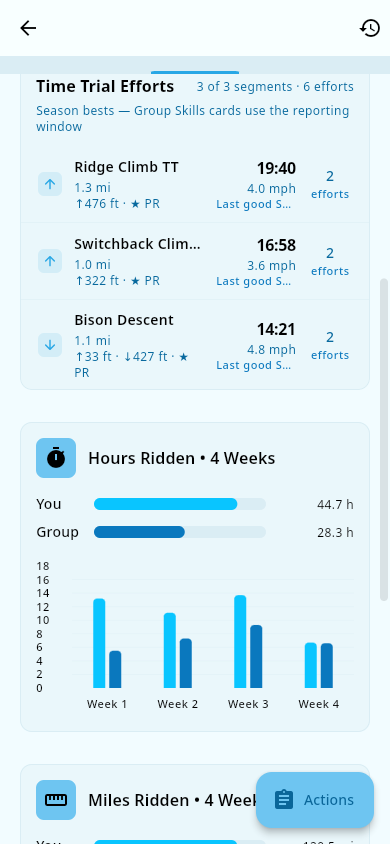 Scrolling down to segment efforts: the athlete's times on timed segments.
What you should see: four weeks of bars (blank weeks are shown as empty rather than skipped), so the trend is easy to read at a glance. If the athlete hasn't synced rides, their ride numbers show as unknown or a dash in coach views — not as zero — until they sync one.
Training zones and FTP
Groupset estimates each athlete's FTP (Functional Threshold Power) automatically: roughly 95% of their best 20-minute power, using about the last 60 days of synced rides. Max heart rate is estimated from about the last 90 days. Training zones — the heart-rate and power ranges used to gauge how hard an effort is — are derived from those two numbers, and appear as zone charts on an activity's detail screen.
Season objective
An athlete's Season Objective is their personal goal for the season, chosen from a few set categories (for example, development or performance). It's the one performance field the athlete edits themselves, from Profile edit. Saving it requires the athlete's email to be verified first; if it isn't, the save fails with a generic "Failed to update profile" message that doesn't explain why. If you see that error, verify your email first, then try again. Coaches and admins see the objective as the athlete's season goal category in the dashboard views.
Notes and limits
- Every assigned coach sees the dashboard regardless of license level — Level 1 coaches get exactly the same groups' data as higher-level coaches. Viewing medical information is still a separate, higher-level gate (see Roles and permissions).
- Group choices come from the groups you're assigned to, so you can't accidentally request data for a group you don't coach.
- Only Strava-synced rides count toward the ride-based numbers; a ride entered by hand doesn't feed the team dashboard's ride metrics.
- Distances, elevation, and speed are shown in the units set on the athlete's own profile (miles and feet, or kilometers and meters) — see Profile and account settings.
- The same underlying segment data powers race comparisons and coach recommendations — see Coach insights and Check-out reporting.
Related pages
- Strava activities — connect and sync rides so the numbers appear.
- Race results — the race-day Results tab, fed by the same synced-data pipeline.
- Profile and account settings — set units and your season objective.
- Attendance — attendance-based numbers in personal performance.
- Coach insights — coaches' weekly read on the same data, with links that open the right dashboard card.
- Checkout-reporting-gcr — how percentile previews are used when moving athletes between groups.
- Glossary — definitions of median, percentile, segment, and time trial.